Valli del Pasubio
Valli del Pasubio- Key information
- Quality of Life
3.9
3.9
- Quality of Infrastructure
1.7
1.7
- Quality of Economy
3.4
3.4
- Region
Veneto
Veneto
- Elevation
[?]
Elevation of a city refers to the height above sea level at which the city is located, measured in meters.
347
347
- Population
[?]
This is a town's official population, measured each year by the national statistics authority.
3100
3100
- Real Population (5km band)
[?]
Our "Real Population" metric reflects more accurately a town's real size by including inhabitants in the immediate vicinity of the town's official borders.
33900
33900
- Climate Description
Moderate rainfall with ample sunshine; chilly winters and warm summers offer a varied climate experience.
- Air Quality Rating
3.8
3.8
- Avg Download Speed (Mbps) / Avg Upload Speed (Mbps)
17 /
2
- Walkability
Somewhat Walkable
- Housing availability
[?]
Based on total number of properties (sale and rent) classifies housing availability into five categories: low, relativel ylow, medium, relatively high and high.
Low
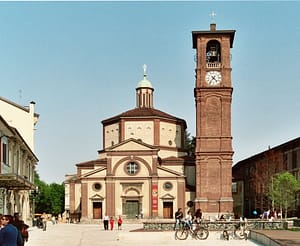
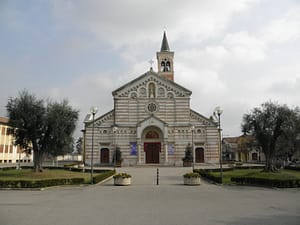
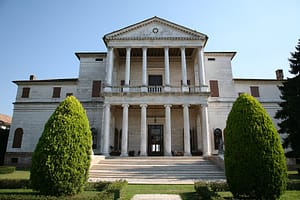
Photos of Valli del Pasubio
Valli del Pasubio Demographics
Population
[?]
This is a town's official population, measured each year by the national statistics authority.
0
Real Population (5km band)
[?]
Our "Real Population" metric reflects more accurately a town's real size by including inhabitants in the immediate vicinity of the town's official borders.
0
Birth to Death Ratio Percentile
[?]
Calculation of the percentile in which the city falls based on the number of births and deaths for year 2023 for the town. In practice, this metric explains how many more deaths than births occur (or vice versa)
Example: Low percentile (near 0): The location has a relatively low birth to death ratio compared to others in Italy. Mid-range percentile (around 0.5): The location has an average birth to death ratio. High percentile (near 1): The location has a relatively high birth to death ratio compared to others.
Example: Low percentile (near 0): The location has a relatively low birth to death ratio compared to others in Italy. Mid-range percentile (around 0.5): The location has an average birth to death ratio. High percentile (near 1): The location has a relatively high birth to death ratio compared to others.
0
Population Data Source
ISTAT,2023
Total Tourists (2023)
[?]
Total number of tourists (foreign and domestic) for years 2005 and 2023 for the city.
0
Touristy Index (2023)
[?]
Calculation of tourist density index for the city, comparing its total tourist number to the overall average tourist number of the region
relative to its own population.The index indicates how a location’s tourist density compares to the average, with values above
100 representing higher-than-average density and values below 100 representing lower-than-average density. In practice, numbers very much higher than 100
0
Income per capita (2023)
[?]
This is an estimation of average income per resident for this town, based on 2023 data from the Italian Ministry of Finance.
0
Income rank in Italy (2023)
[?]
This is a ranking of the town's average income per resident, against the full list of townships in Italy.
2747 out of 7901
Infrastructure and Connectivity
Closest Airport
[?]
Name of the closest airport in the NUTS2 region from the city..
Verona Villafranca Airport
Drive time to Airport
[?]
Calculation of the drive time in (mins) to the closest airport the from city.
0
minutes
Distance to Closest Beach Resort
[?]
Calculation of the minimum distance ("as the crow flies") between each city and the closest POI, in this case beach or mountain..
0
km
Distance to Closest Mountain Resort
0
km
Distances to Major Airports
Verona
0
km
Venice
0
km
Treviso
0
km
Bergamo
0
km
Bologna
0
km
Infrastructure & Amenities
POIs 10km 30km
| POI_Type | 10km | 30km |
|---|---|---|
| Auto Repair Shops | 71 | 832 |
| Bars | 73 | 561 |
| Cafes | 54 | 391 |
| Cinemas | 3 | 18 |
| Dentists | 12 | 100 |
| Golf Courses | 0 | 5 |
| Gyms | 4 | 101 |
| Hiking Trails | 24 | 119 |
| Historical Sites | 5 | 75 |
| Hospitals | 1 | 12 |
| Libraries | 2 | 30 |
| Museums | 7 | 51 |
| Parks | 12 | 79 |
| Pharmacies | 16 | 123 |
| Restaurants | 91 | 713 |
| Shopping Centres | 1 | 57 |
| Spas | 39 | 503 |
| Supermarkets | 54 | 315 |
Within 10km
Hospitals
0
Auto Repair Shops
0
Bars
0
Cafes
0
Cinemas
0
Dentists
0
Golf Courses
0
Gyms
0
Health Clinics
0
Hiking Trails
0
Historical Sites
0
Libraries
0
Museums
0
Parks
0
Pharmacies
0
Restaurants
0
Shopping Centres
0
Supermarkets
0
Beauty Centres (Spas)
0
Healthcare & Safety
Nearest Hospital Name
Alto Vicentino-Pronto Socc
Drive Time to Nearest Hospital
0
minutes
Number of hospitals within 30-min drive
0
Seismic Zone (risk of earthquakes)
[?]
Official seismic zones classify areas based on earthquake risk.
Moderate Earthquake Risk
Road Accidents Rate per 10k Inhabitants
[?]
Calculation of road accidents per 10,000 people based on the number of deaths and injuries registered in roads for year 2022 for the city.
0
Car Insurance Price Index
[?]
The car insurance price index is a measure of how a city's average car insurance premium compares to the national average,
expressed as a percentage. A value of 100 indicates that the city's premium is equal to the national average.
Values above 100 show higher premiums, while values below 100 show lower premiums.
0
Average Annual Car Insurance Cost
0
Housing & Property Market
Housing availability
[?]
Based on total number of properties (sale and rent) classifies housing availability into five categories: low, relativel ylow, medium, relatively high and high.
Low
Property Prices per m²
Low (lowest 25%)
0
Median
0
High (highest 25%)
0
Connectivity & Digital Access
Walkability Description
Somewhat Walkable
Avg Download Speed (Mbps)
17
Fast Download Speed (Mbps)
25
Slow Download Speed (Mbps)
7
Education
Avg Schools Ranking (All Criteria)
[?]
This ranking shows in which decile the town's public schools fall while looking at all the indicators provided by the Italian Ministry of Education for the most recent available year. Note that figures are only provided by the ministry at the school catchment area level, and therefore several schools may be grouped together.
Top 10%
Avg Schools Ranking (Standardised Tests)
[?]
This ranking shows in which decile the town's public schools fall while looking the students' results in national standardised tests. The data is provided by the Italian Ministry of Education for the most recent available year.
Top 10%
Counts of School
| Town/City | Primary Schools | Kindergartens | Comprehensive Schools | Medium High Schools | Scientific High Schools | Technical Commercial Schools | Classical High Schools | Industrial Technical Schools | Higher Education Institutes |
|---|---|---|---|---|---|---|---|---|---|
| Valli del Pasubio | 1 | 0 | N/A | 1 | N/A | N/A | N/A | N/A | N/A |
Climate & Weather
Precipitation
[?]
Based on daily climate data for precipitation from OPEN-METEO this parameter indicates how a city's annual precipitation compares to others
in terms of percentage, with values ranging from 0 (lowest) to 1 (highest). For example, a percentile rank of 0.75 means the city's
total precipitation is higher than 75% of other cities.
High (71st-80th percentile)
Sunshine
Low (11th-20th percentile)
Snowfall
Somewhat High (61st-70th percentile)
Min Annual Temperature (°C)
[?] This parameter represents the monthly average of daily minimum temperatures for January, based on data from OPEN-METEO.
-1.2
Max Annual Temperature (°C)
[?] This parameter represents the monthly average of daily minimum temperatures for January, based on data from OPEN-METEO.
26.1
Climate Description
Valli del Pasubio presents a climate characterized by moderations suitable for those accustomed to the varied European weather. The village experiences a refreshing range of temperatures that remain gentle year-round without extreme cold or excessive heat, ensuring comfortable living for expats and retirees. This region enjoys ample sunshine, benefiting outdoor activities and local agriculture, yet it receives sufficient rainfall to sustain its lush landscapes and natural reserves. Snowfall is modest, typically light and ephemeral, highlighting winter months without imposing severe disruptions. Ideal for those seeking a climate that supports both relaxation and active exploration, Valli del Pasubio offers a balanced environment.
Annual Temperature Chart (Min)
Climate data provided by Open Meteo, based on 2010–2022 averages.
| Town | Min Temp Jan | Min Temp Feb | Min Temp Mar | Min Temp Apr | Min Temp May | Min Temp Jun | Min Temp Jul | Min Temp Aug | Min Temp Sep | Min Temp Oct | Min Temp Nov | Min Temp Dec |
|---|---|---|---|---|---|---|---|---|---|---|---|---|
| Valli del Pasubio | -1,20 | -0,10 | 2,70 | 7,00 | 10,30 | 14,90 | 17,00 | 17,10 | 13,30 | 8,90 | 4,20 | -0,40 |
Annual Temperature Chart (Max)
Climate data provided by Open Meteo, based on 2010–2022 averages.
| Town | Max Temp Jan | Max Temp Feb | Max Temp Mar | Max Temp Apr | Max Temp May | Max Temp Jun | Max Temp Jul | Max Temp Aug | Max Temp Sep | Max Temp Oct | Max Temp Nov | Max Temp Dec |
|---|---|---|---|---|---|---|---|---|---|---|---|---|
| Valli del Pasubio | 6,1 | 7,70 | 12,00 | 16,20 | 19,40 | 24,00 | 26,10 | 26,10 | 21,50 | 16,40 | 11,30 | 7,40 |
Sunny Days By Month
Climate data provided by Open Meteo, based on 2010–2022 averages.
| Town | Sunny Days % Jan | Sunny Days % Feb | Sunny Days % Mar | Sunny Days % Apr | Sunny Days % May | Sunny Days % Jun | Sunny Days % Jul | Sunny Days % Aug | Sunny Days % Sep | Sunny Days % Oct | Sunny Days % Nov | Sunny Days % Dec |
|---|---|---|---|---|---|---|---|---|---|---|---|---|
| Valli del Pasubio | 54 | 39 | 55 | 48 | 53 | 56 | 60 | 62 | 50 | 39 | 35 | 56 |
Environmental & Air Quality
Classifications
PM10
[?]
PM10 levels indicate Good air quality at 0–20 µg/m³, Fair at 20–40 µg/m³, Moderate at 40–50 µg/m³, Poor at 50–100 µg/m³, Very Poor at 100–150 µg/m³, and Extremely Poor at 150–1200 µg/m³.
Good
PM2.5
[?]
PM2.5 is Good if PM2.5 levels are between 0–10 µg/m³, Fair between 10–20 µg/m³, Moderate between 20–25 µg/m³, Poor between 25–50 µg/m³, Very Poor between 50–75 µg/m³, and Extremely Poor between 75–800 µg/m³.
Fair
NO2
[?]
NO₂ levels are considered Good at 0–40 µg/m³, Fair at 40–90 µg/m³, Moderate at 90–120 µg/m³, Poor at 120–230 µg/m³, Very Poor at 230–340 µg/m³, and Extremely Poor at 340–1000 µg/m³.
Good
SO2
[?]
SO₂ levels indicate Good air quality at 0–100 µg/m³, Fair at 100–200 µg/m³, Moderate at 200–350 µg/m³, Poor at 350–500 µg/m³, Very Poor at 500–750 µg/m³, and Extremely Poor at 750–1250 µg/m³.
Good
O₃
[?]
For O₃, the air is Good at 0–50 µg/m³, Fair at 50–100 µg/m³, Moderate at 100–130 µg/m³, Poor at 130–240 µg/m³, Very Poor at 240–380 µg/m³, and Extremely Poor at 380–800 µg/m³.
Fair
Air Quality Rating
Air Quality Description
In Valli del Pasubio, Italy, the air quality generally upholds a commendable standard, contributing positively to the living environment for residents and visitors alike. Particulate matter with a diameter of 10 microns or smaller (PM10) and nitrogen dioxide levels are especially favorable, reflecting the locale’s adherence to environmental standards and its relatively unpolluted atmosphere. However, attention might be directed towards the moderate presence of finer particulates (PM2.5) and ozone, which, while acceptable, indicate areas where improvements could be beneficial. This balance underscores Valli del Pasubio’s appeal as a destination prioritizing both natural beauty and public health.
Town Descriptions
Getting There
Getting Around
Local Cuisine
Green Areas and Parks
✅ Pros
❌ Cons
FAQs
Related Posts
No posts found for the town.
More questions about Valli del Pasubio ? Ask Magic AI.
Our innovative AI assistant is eager to help. Try it out for free here: